Measuring Momentum
Building a Scalable Framework for UX Performance Tracking
Challenge
As Mercari prepared to roll out three major product features in 2023, the team lacked a structured approach to track how these changes would impact user experience and business performance over time. Without this, we risked making decisions without fully understanding user satisfaction or identifying functionality issues that could arise as the platform evolved.
Objective
Develop a comprehensive benchmarking system to monitor key UX metrics over time, enabling Mercari to make data-driven, user-centered decisions.
My Role
As the UX Researcher and project lead, I was responsible for study design, research strategy, stakeholder collaboration, data visualization, and training and enablement.
Problem
Mercari’s UX was evolving rapidly, but there was no reliable way to measure how each new feature affected the overall user experience. This left the team without insights into user satisfaction, ease of navigation, or product usability across different segments. Additionally, there was strong interest in understanding Mercari's performance relative to key competitors, such as eBay and Depop.
Core Question
How can we create a system that reliably tracks user experience, identifies usability issues, and informs product decisions across multiple launches?
Vision
Our vision was to create a scalable UX benchmarking system that would:
- Track key UX metrics over time to detect changes in usability and user satisfaction.
- Allow comparisons with competitors to understand market positioning.
- Provide actionable insights to inform product strategy and feature prioritization.
A few examples of Mercari's major FY24 feature releases that we sought to systematically collect user feedback for.
Approach
Stakeholder Interviews
To ensure the benchmarking system met organizational needs, I conducted interviews and team discussions with key stakeholders, including product managers, UX designers, and data engineers. The main takeaways were:
- Interest in a lightweight, consistent approach that could be adapted across product releases.
- A preference for metrics like ease of use, community engagement, and task efficiency.
- Agreement to benchmark against eBay consistently, with flexibility to alternate other competitors (e.g., Depop or WhatNot) based on market relevance.
Study Plan
The study plan outlined three primary goals:
- Measure alignment with company objectives and UX values.
- Compare user engagement and satisfaction with competitors.
- Track performance of key product areas, such as listing, community, and onboarding, over time.
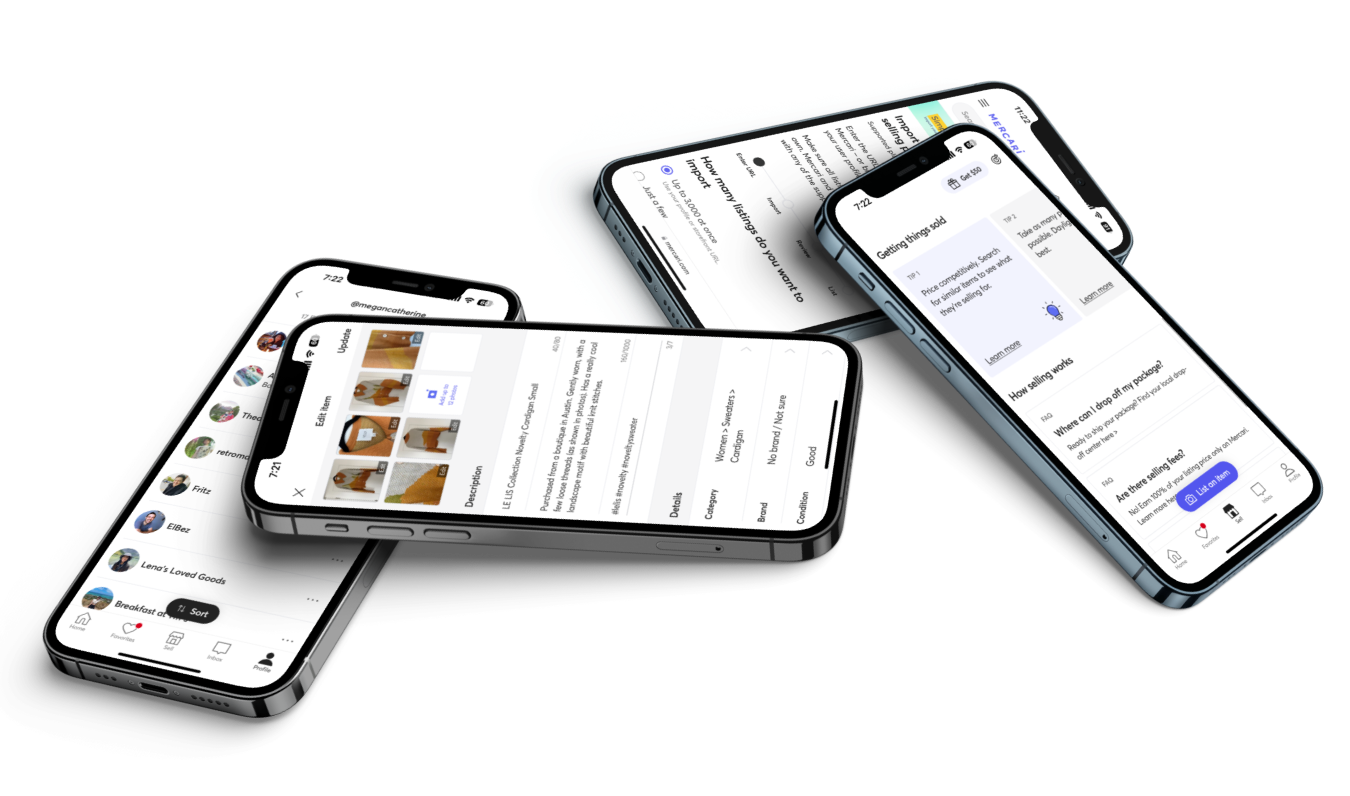
The key product ideas identified included listing, community, and onboarding.
Journey Mapping & Key Task Identification
Key Task IdentificationIn collaboration with UX designers, we identified critical user tasks to focus on, such as listing items, browsing, and checkout. This selection was guided by internal metrics and team input on areas with the highest impact potential.
Journey MappingI leveraged user journey maps for each task to understand pain points and potential friction areas. This mapping allowed us to design survey questions that targeted each stage of the user journey, from onboarding to post-purchase engagement, ensuring the benchmarking system captured comprehensive user feedback.
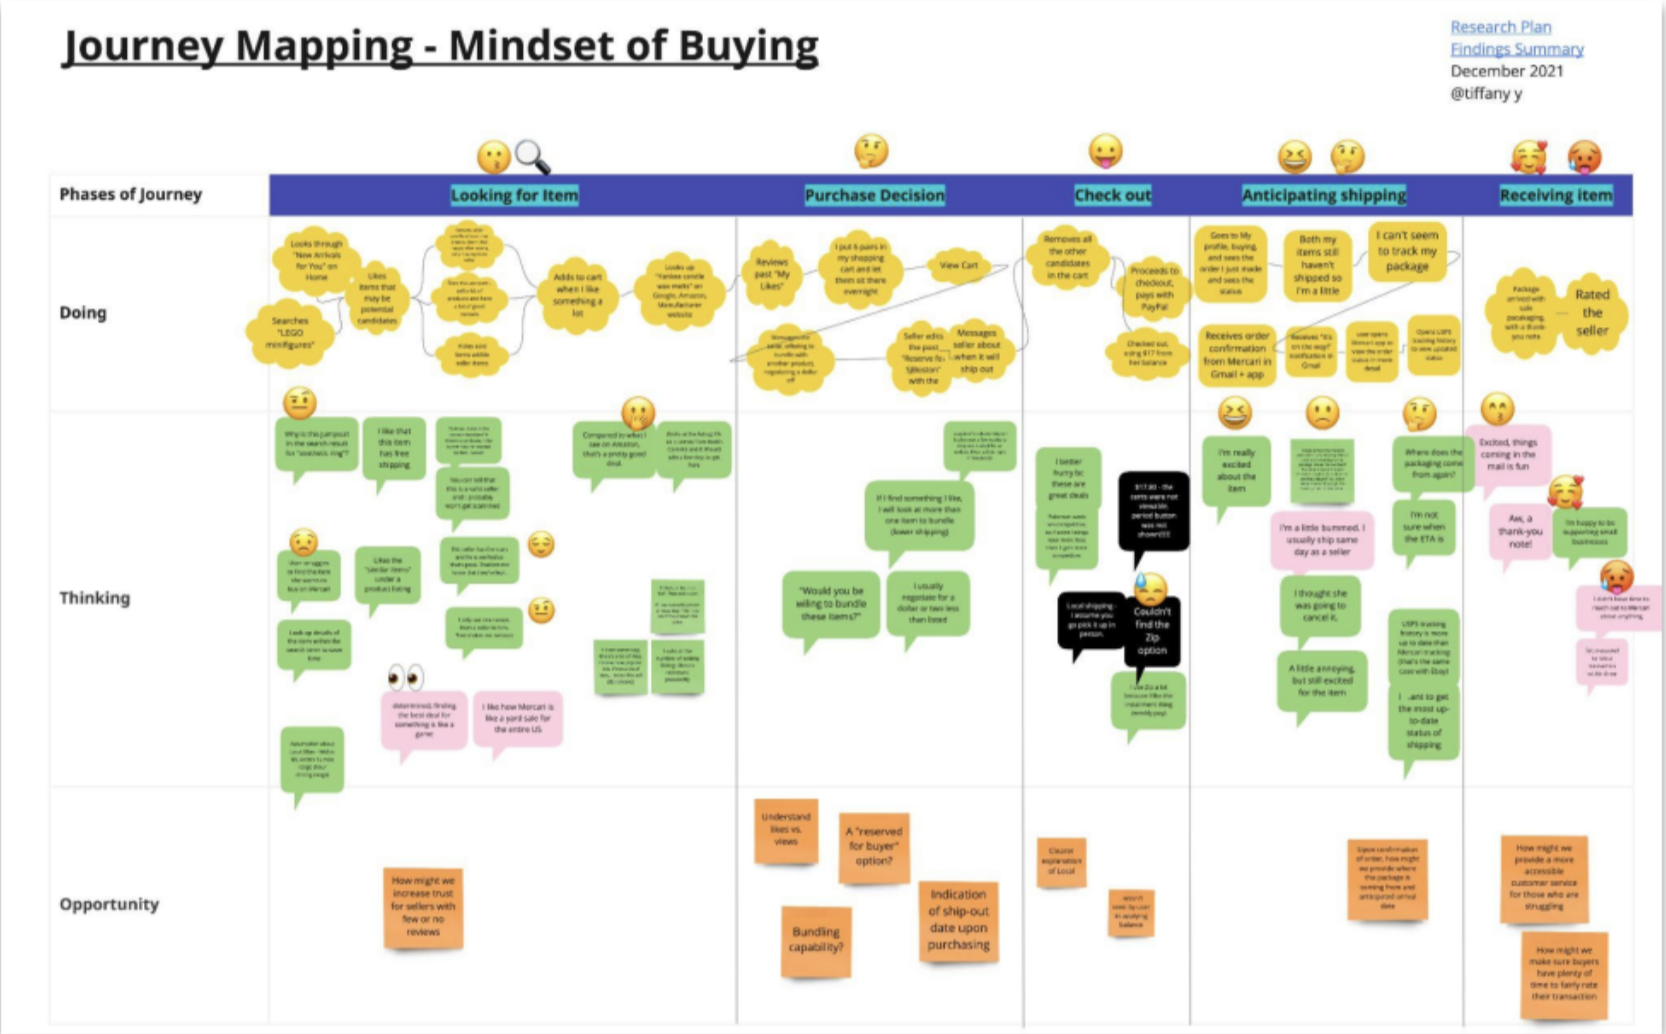
I used journey maps created from prior studies. This one was created by my wonderful colleague, Tiffany Yang.
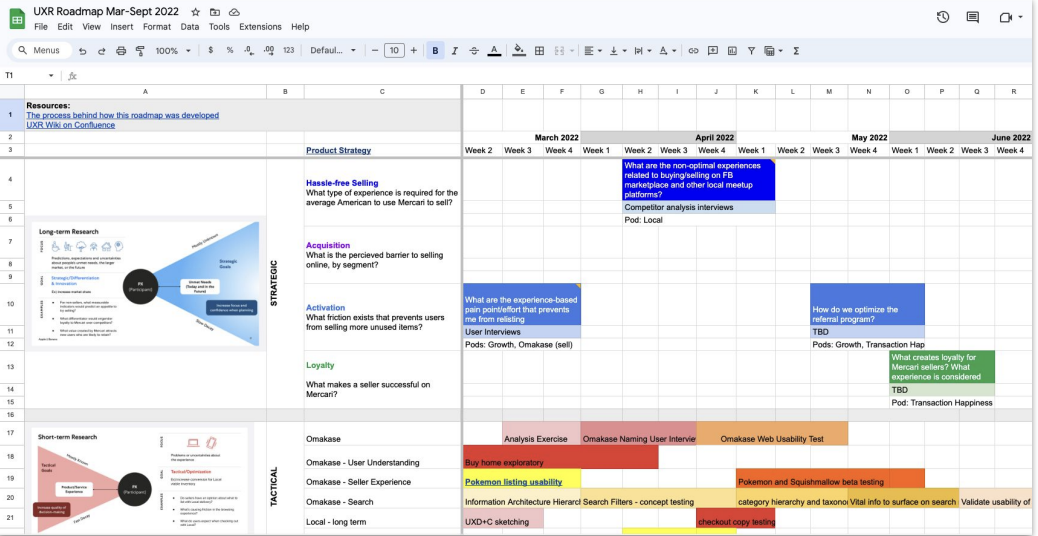
I collaborated with stakeholders to chart our research roadmap for the coming quarters and understand priorities for a holistic product benchmarking solution.
Survey Design
We aligned as a team on key measures, blending unique and standardized measures, and allowing for open-text responses. We incorporated elements from the System Usability Scale (SUS) and the Google HEART framework to provide standardized, comparable metrics. This addition helped align our metrics with industry benchmarks and gave us insights into areas like user satisfaction and engagement
System Design & Implementation
Recruitment & Sampling StrategyI used a sampling strategy targeting users who accessed Mercari within the last week, ensuring we reached an active user base. The surveys were delivered via Sprig, and incentives like gift card sweepstakes were offered to encourage participation and improve data quality.
Looker Dashboard DevelopmentI collaborated with data engineers to set up a pipeline to ingest Sprig data into Looker. I created the Looker dashboards that displayed real-time data from the surveys. These dashboards allowed stakeholders across the organization to track trends in user sentiment, identify pain points, and compare Mercari’s performance against competitors in real-time.

We included a few items from the SUS and the Product-Market Fit survey for continuity, as well as some measures unique to Mercari.
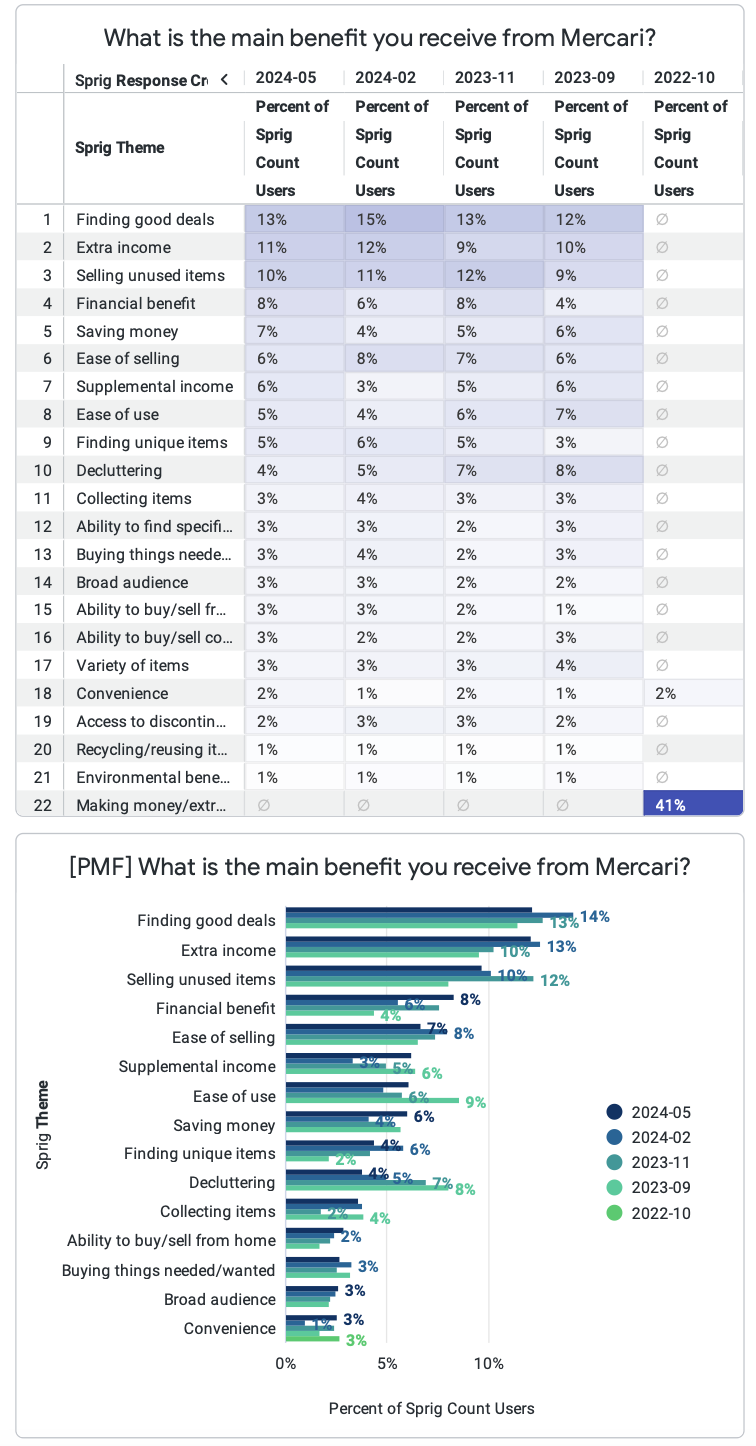
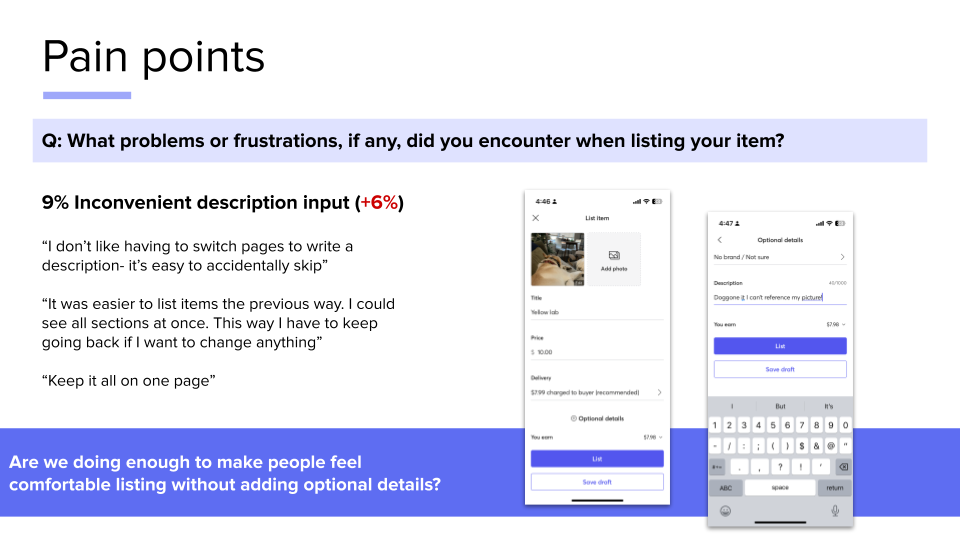
The Looker dashboard showed how AI-generated themes from open-text questions changed over time.
Results
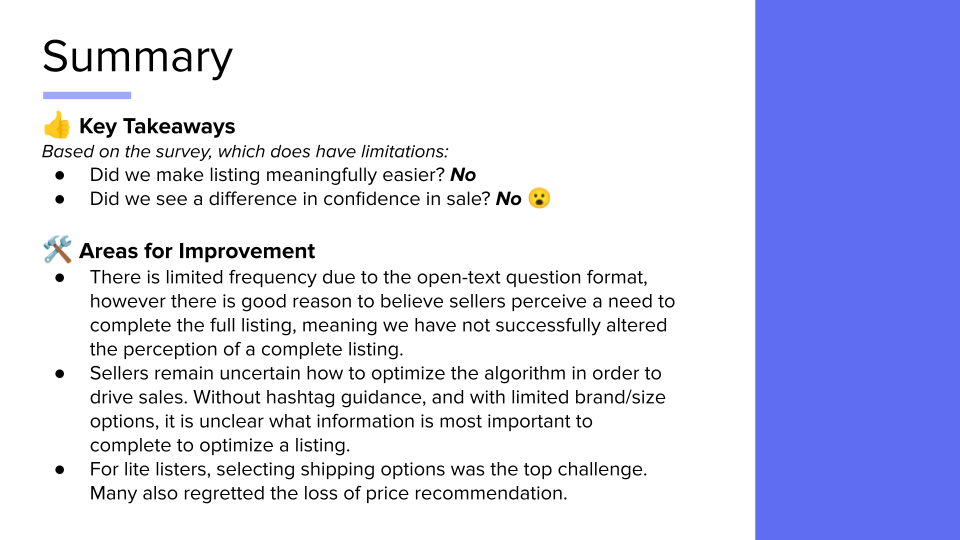
- Guided decision-making around AI listing feature iterations. The listing benchmarking survey provided critical evidence that was used to chart the path for experimentation with a later feature release in the US which was further explored in an international marketplace by Mercari JP.
- Improved search functionality. Benchmarking revealed that search functionality was a key pain point. Targeted improvements to the search interface resulted in a +13% increase in order volume in previously underperforming categories. I gathered input from product managers, UX leaders, and data engineers to co-create a recruitment plan and survey content. By collaborating with cross-functional teams, I ensured that the resulting data would meet the needs of all key stakeholders.
- Enhanced product insights. The Looker dashboards democratized UX insights, allowing product managers, designers, and engineers to access data-driven feedback easily. This accessibility led to more informed, user-centered decisions and cross-functional collaboration.
- Growth in team analytics skills. I led training sessions to ensure the team was proficient in using the dashboards, fostering a culture of data-driven insights within the UX department.
Reflection & Learnings
The complexity of integrating multiple data sources and aligning stakeholders across functions was one of the biggest challenges. My approach to facilitating collaboration and keeping the system accessible played a key role in overcoming these obstacles. The system has now been adopted as a long-term strategy for tracking UX metrics.
We went from scrappy and haphazard experience measurement to a robust and rich system, which Megan is fully credited with.


